War in Our Shared House
What it costs life—and what we could build together.
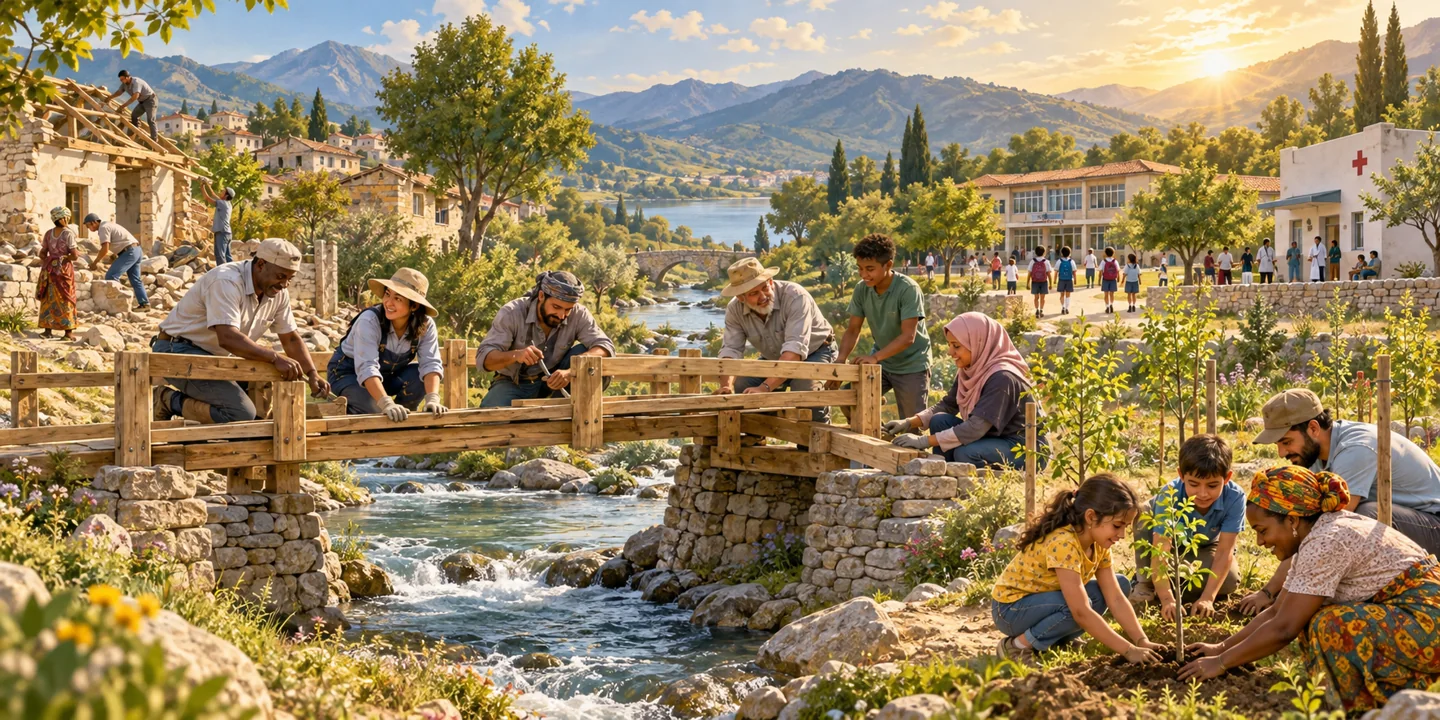
When a room in our shared house burns, the consequences do not stop at its doorway. War destroys lives and the systems that sustain them. Its effects travel through food supplies, waterways, trade, migration and the atmosphere. People far from the battlefield can feel its costs, while damage to ecosystems can outlast the fighting.
This article asks how humanity could create security that protects life while reducing the need to wage war. It examines actions and evidence without assigning collective blame to a nationality, religion or population. Responsibility for particular actions still matters; equal respect for people does not require treating every claim or action as equally justified.
Research date: 11 October 2026. Conflict conditions change rapidly. The examples below are a selected overview, not a complete list or live battlefield tracker. Explore military spending and historical personnel figures for all 199 country houses.
Conflict today: different rooms, connected consequences
| Situation | Context and consequences | Source and reporting period |
|---|---|---|
| Russia–Ukraine | Russia’s full-scale invasion began in 2022. Continuing attacks, displacement and damaged energy, housing and public services create immediate needs and a long recovery burden. The joint recovery assessment estimated almost $588 billion in needs over a decade, using damage recorded through December 2025. | World Bank / Ukraine / EU / UN, February 2026; OCHA current reporting |
| Israel / occupied Palestinian territory, particularly Gaza | The Hamas-led attacks of October 2023 and the ensuing war caused profound harm. Ceasefire arrangements do not erase deaths, displacement or destroyed services. Current reporting addresses continuing humanitarian needs; environmental recovery involves debris, water, sewage and contamination. | OCHA, 2 October 2026; UNEP environmental assessment |
| Sudan | War between the Sudanese Armed Forces and Rapid Support Forces began in April 2023 amid a struggle over military integration and power. Civilians face attacks, hunger, displacement and damaged health, water and electricity services. Recent OCHA reporting continues to warn about civilian harm. | Geneva Academy background, January 2026; OCHA, 8 October 2026 |
| Myanmar | Conflict involving the military and numerous armed groups intersects with displacement, economic disruption and climate shocks. An October UNDP report describes overlapping losses in health, education and living standards. | UNDP, 8 October 2026; UNHCR situation portal |
| Eastern Democratic Republic of the Congo | Armed groups, regional involvement and unresolved political and security disputes continue to threaten civilians. Protection, displacement, accountability and natural-resource governance are interconnected concerns. | UN Security Council reporting, 29 September 2026; OCHA |
| Yemen and the Red Sea | Internal armed conflict and international involvement interact with attacks, damaged livelihoods and disrupted shipping. Changes in fighting and agreements require dated sources rather than assuming the situation is unchanged. | Geneva Academy analysis, 2026; OCHA, 5 October 2026 |
| Somalia | Fighting involving Al-Shabaab, government forces and international partners persists amid political tensions and humanitarian needs. Civilians’ ability to obtain food and services depends on both security and reliable public institutions. | EUAA security report, 2026 |
| Lebanon, Iran and the wider Middle East | The 2026 escalation has created additional displacement and regional protection needs. These connected situations should not be collapsed into one conflict: parties, ceasefires and legal classifications differ. | UNHCR regional situation, including September 2026 material; Geneva Academy Lebanon assessment, October 2026 |
Other armed conflicts and organized violence also require attention. Explore Geneva Academy’s conflict analyses and OCHA humanitarian reporting. A ceasefire, reduced fighting and a durable peace are different conditions. Published death counts may omit missing people and indirect deaths; this article does not combine incompatible counts into a purported worldwide total.
The cost extends beyond the battlefield
People and future generations
Deaths and injuries are only part of the damage. Families lose homes, income and access to treatment. Children lose learning time and safety. Disability, grief, sexual violence, separation and forced displacement can leave lasting effects. Damaged water and health services can turn preventable disease into an additional emergency. Soldiers and their families also bear injuries, trauma and disrupted lives.
UNHCR’s 2025 global report documents the scale of forced displacement. These figures cover persecution, conflict, violence and related causes; they are not a count attributable only to the wars listed here.
Animals, plants, soil and water
Bombardment, fires, destroyed industrial facilities and failed sewage systems can contaminate land and water. Explosive remnants restrict farming and restoration. Fighting can destroy habitats and prevent conservation work. When livelihoods collapse, people may have little choice but to cut trees or hunt wildlife to survive; the responsibility includes the conditions that removed safer options.
UNEP documents environmental damage in Gaza and historical examples elsewhere: wildlife losses and resource exploitation in the Congo, toxic pollution and wetland destruction in Iraq, forest degradation in Afghanistan and mining pollution in Colombia. These examples have different dates and causes; they illustrate pathways of harm, not measurements of every current battlefield.
Sources: UNEP Gaza assessment; UNEP: biodiversity and conflict.
Effects across the greater house
Disrupted ports, roads, crops and energy supplies can raise costs and interrupt deliveries elsewhere. Refugee-hosting communities need support. Military operations, manufacturing and reconstruction use fuel and materials; emissions accounting is incomplete, so we do not assign an unsupported global percentage. Reconstruction can require communities to spend resources replacing what they already had instead of improving their futures.
The wider cost includes opportunities forgone: engineers, nurses, researchers, workers and public funds could contribute to other needs. That does not mean every military function is destructive. Armed forces can provide defence, rescue and disaster logistics. The question is which arrangements protect people most effectively while reducing total harm.
What could we build with a different allocation?
SIPRI estimates world military spending at $2.887 trillion in 2025. This is expenditure across military functions, not the price of the current wars alone. Information from the Stockholm International Peace Research Institute (SIPRI), Military Expenditure Database and 2025 spending report.
| Illustrative annual redirection | Amount using the 2025 total |
|---|---|
| 1% | $28.87 billion |
| 5% | $144.35 billion |
| 10% | $288.70 billion |
These are arithmetic scenarios: total × share. They are not forecasts, agreed budgets or a recommendation for unilateral cuts during an attack. Savings require actual spending reductions; reallocations should not be counted twice or assumed immediately available.
| Where effort could go | Practical work | Potential benefit to life |
|---|---|---|
| Clean water and sanitation | Repair pipes, protect watersheds, treat sewage and monitor pollution. | Less preventable disease; cleaner rivers and healthier aquatic ecosystems. |
| Food and soils | Support farmers, restore soil, improve storage and distribute food reliably. | Less hunger and waste; more resilient farms and habitats. |
| Medical care | Train and retain staff, equip clinics, provide rehabilitation and prevention. | Healthier communities and better recovery from injury and illness. |
| Education and creativity | Support safe schools, mentors, libraries and access for displaced children. | More freedom to learn, contribute and explore meaningful work. |
| Housing and infrastructure | Repair homes, reuse materials and strengthen roads, bridges and communications. | Safer lives and less material waste; reliable access to services. |
| Cleaner energy | Build suitable generation, grids, storage and efficiency improvements. | Lower pollution and emissions when projects are responsibly designed. |
| Ecosystem restoration | Restore wetlands, forests and coastal habitats with local communities. | Better water regulation, wildlife habitat and carbon storage. |
| Disaster preparedness | Improve warnings, evacuation, resilient services and emergency logistics. | Fewer avoidable losses when floods, storms or heatwaves occur. |
| Peacebuilding and recovery | Clear explosive remnants, support mediation, justice and reintegration. | Safer land and a stronger foundation for peace. |
For scale, UNEP estimates developing-country adaptation needs in 2035 at $310–365 billion annually in 2023 prices. That is a future estimate for a particular purpose, not directly interchangeable with 2025 military spending in current dollars. It illustrates the size of needs, not proof that one transfer solves them.
UNEP Adaptation Gap Report 2025. Real results depend on trained people, land rights, local decisions, effective procurement, maintenance and safeguards against corruption. Money alone cannot create them.
What needs to change—and what stands in the way?
People cannot be asked to accept vulnerability while another party threatens them. The security dilemma is real: preparations described as defensive by one country may appear threatening to another and prompt further spending. Durable reductions require credible arrangements, not simply a request that one side stop protecting itself.
- Protect civilians now: humanitarian access, protection of essential services and compliance with international humanitarian law cannot wait for a final settlement.
- Create dependable dialogue: mediation, communication channels and negotiated arrangements need clear commitments, monitoring and responses to violations.
- Reduce dangers through verifiable agreements: arms-control measures, inspections and confidence-building can make restraint safer when designed for the actual situation.
- Address unresolved grievances: security, rights, territory, political exclusion and access to resources require genuine participation by affected people.
- Make public decisions accountable: explain budgets, procurement, conflicts of interest, expected benefits and civilian consequences.
- Provide livelihoods through transition: military personnel and workers in defence industries need credible routes into civilian employment, training, income protection and pensions.
- Build reliable public services: water, food, health, education and accountable institutions help create security in daily life.
- Keep learning: measure whether agreements and investments reduce harm; revise approaches when evidence shows failure.
Obstacles include distrust, fear of attack, unresolved grievances, political survival, influence from arms contracts, misinformation, resource competition and institutions that reward escalation. These are possible mechanisms to investigate, not motives we can assign to every leader without evidence. Benefiting economically from conflict does not by itself establish that a person or company caused it.
Nonviolent participation, dialogue and respect are central to this website’s approach. They work alongside accountability and protection, not in place of them. AI can assist with budgets, supply chains, early warnings and comparison of proposals; it can also amplify surveillance, propaganda or weapons. Its value depends on the task, reliable information, public safeguards and accountable human decisions.
Questions any resident can ask
- What threats does this military budget address, and what evidence supports the spending?
- Which services or environmental repairs remain unfunded, and why?
- Are less destructive ways of providing security being seriously examined?
- Who benefits from procurement, and are conflicts of interest disclosed?
- How are civilians, ecosystems and future generations considered?
- What conditions would allow verified reductions without exposing people to attack?
- How could workers and communities help design a peaceful transition?
Our shared-house question: can we build security that makes every room safer while allowing more of humanity’s time, money and creativity to sustain life?
Ask a question · Share evidence or suggest a correction · Explore your country house
Military reference: all 199 country houses
Spending: 2025. Personnel: historical observations, generally 2020. This is not a directory of current force strengths. The open personnel series ends in 2020 and includes active military plus qualifying active paramilitary personnel; it excludes reservists. Separate active, reserve and paramilitary figures are not available consistently in this source, so they are not invented or labelled interchangeable.
Spending is in current US dollars, rounded for readability. Per-resident spending is an average, not an individual tax bill. Share of GDP measures the economic burden, not the government budget share. Missing data is not zero. A recorded zero does not establish that a country has no security expenditure. Personnel are not a measure of capability, and mixed-year columns should not be divided to calculate a current cost per soldier.
Information from the Stockholm International Peace Research Institute (SIPRI), Military Expenditure Database, April 2026 edition. Personnel: World Bank WDI / IISS Military Balance, definition and limitations, CC BY 4.0. Reviewed 11 October 2026. Source estimates and uncertainty flags are retained; individual country footnotes should be checked in SIPRI before drawing detailed comparisons.
| Country | Historical personnel (year) | Annual spending, US$ millions (2025) | US$ per resident (2025) | % of GDP (2025) | Source notes |
|---|---|---|---|---|---|
| Afghanistan | 165,000 (2020) | Not available | Not available | Not available | See source methodology; source footnote 2 |
| Albania | 8,000 (2020) | 623.6 | 224 | 2.03 | See source methodology; source footnote §¶3 |
| Algeria | 326,000 (2020) | 25,438.8 | 540 | 8.83 | See source methodology; source footnote §4 |
| Andorra | Not available | Not available | Not available | Not available | See source methodology |
| Angola | 117,000 (2020) | 1,459.2 | 38 | 1.40 | See source methodology; source footnote §‖1 |
| Antigua and Barbuda | 0 (2020) | Not available | Not available | Not available | See source methodology |
| Argentina | 103,000 (2020) | 3,875.8 | 85 | 0.56 | high uncertainty; source footnote 5 |
| Armenia | 47,000 (2020) | 1,725.2 | 582 | 6.09 | See source methodology; source footnote †6 |
| Australia | 60,000 (2020) | 35,326.6 | 1,316 | 1.92 | See source methodology |
| Austria | 23,000 (2020) | 6,353.4 | 697 | 1.10 | See source methodology; source footnote ... |
| Azerbaijan | 82,000 (2020) | 4,939.0 | 476 | 6.47 | See source methodology; source footnote ‖7 |
| Bahamas | 2,000 (2020) | Not available | Not available | Not available | See source methodology |
| Bahrain | 19,000 (2020) | 1,468.2 | 903 | 3.11 | estimate; source footnote 8 |
| Bangladesh | 227,000 (2020) | 3,826.6 | 22 | 0.81 | See source methodology; source footnote 9 |
| Barbados | 1,000 (2020) | Not available | Not available | Not available | See source methodology |
| Belarus | 158,000 (2020) | 1,938.6 | 215 | 2.40 | See source methodology |
| Belgium | 24,000 (2020) | 14,532.0 | 1,237 | 2.01 | See source methodology; source footnote ... |
| Belize | 2,000 (2020) | 33.3 | 79 | 1.00 | See source methodology |
| Benin | 12,000 (2020) | 216.9 | 15 | 0.89 | See source methodology; source footnote § |
| Bhutan | 6,000 (2000) | Not available | Not available | Not available | See source methodology |
| Bolivia | 71,000 (2020) | 688.3 | 55 | 1.21 | See source methodology; source footnote 10 |
| Bosnia and Herzegovina | 11,000 (2020) | 231.4 | 73 | 0.73 | See source methodology; source footnote †§¶11 |
| Botswana | 9,000 (2020) | 614.4 | 242 | 3.11 | See source methodology |
| Brazil | 762,000 (2020) | 23,949.9 | 113 | 1.05 | See source methodology |
| Brunei | 8,000 (2020) | Not available | Not available | Not available | See source methodology; source footnote §12 |
| Bulgaria | 37,000 (2020) | 2,589.2 | 384 | 2.01 | See source methodology; source footnote †13 |
| Burkina Faso | 11,000 (2020) | 891.6 | 37 | 3.30 | See source methodology; source footnote † |
| Burundi | 31,000 (2020) | 226.6 | 16 | 3.24 | See source methodology; source footnote ‡ |
| Cabo Verde | 1,000 (2020) | 20.1 | 38 | 0.66 | See source methodology |
| Cambodia | 191,000 (2020) | 739.0 | 42 | 1.45 | See source methodology |
| Cameroon | 34,000 (2020) | 627.5 | 21 | 1.06 | See source methodology; source footnote § |
| Canada | 72,000 (2020) | 37,494.2 | 939 | 1.63 | See source methodology |
| Central African Republic | 10,000 (2020) | 74.2 | 14 | 2.33 | See source methodology; source footnote 14 |
| Chad | 45,000 (2020) | 648.8 | 31 | 3.19 | See source methodology; source footnote § |
| Chile | 114,000 (2020) | 5,327.9 | 269 | 1.52 | See source methodology; source footnote 45 |
| China | 2,535,000 (2020) | 335,524.2 | 237 | 1.72 | estimate; source footnote 55 |
| Colombia | 428,000 (2020) | 14,502.7 | 273 | 3.20 | See source methodology; source footnote 46 |
| Comoros | Not available | Not available | Not available | Not available | See source methodology |
| Cook Islands | Not available | Not available | Not available | Not available | See source methodology |
| Costa Rica | 10,000 (2020) | 0.0 | 0 | 0.00 | See source methodology; source footnote 37 |
| Croatia | 20,000 (2020) | 2,101.6 | 544 | 2.02 | See source methodology; source footnote 70 |
| Cuba | 76,000 (2020) | Not available | Not available | Not available | See source methodology; source footnote §38 |
| Cyprus | 13,000 (2020) | 663.3 | 486 | 1.61 | See source methodology; source footnote †§ |
| Czechia | 27,000 (2020) | 7,051.5 | 660 | 1.84 | See source methodology; source footnote 71 |
| Côte d’Ivoire | 27,000 (2020) | 759.4 | 23 | 0.77 | See source methodology; source footnote 18 |
| Democratic Republic of the Congo | 134,000 (2020) | 1,225.3 | 11 | 1.38 | See source methodology; source footnote §15 |
| Denmark | 15,000 (2020) | 14,948.8 | 2,495 | 3.25 | See source methodology; source footnote ... |
| Djibouti | 13,000 (2020) | Not available | Not available | Not available | See source methodology; source footnote § |
| Dominica | Not available | Not available | Not available | Not available | See source methodology |
| Dominican Republic | 71,000 (2020) | 1,037.3 | 90 | 0.80 | See source methodology |
| Ecuador | 42,000 (2020) | 2,735.6 | 150 | 2.10 | See source methodology; source footnote 47 |
| Egypt | 836,000 (2020) | 2,501.7 | 21 | 0.61 | See source methodology; source footnote §¶ |
| El Salvador | 42,000 (2020) | 490.0 | 77 | 1.34 | See source methodology; source footnote 39 |
| Equatorial Guinea | 1,000 (2020) | 120.7 | 63 | 0.90 | See source methodology; source footnote § |
| Eritrea | 202,000 (2020) | Not available | Not available | Not available | See source methodology; source footnote §‖19 |
| Estonia | 7,000 (2020) | 1,575.9 | 1,164 | 3.37 | See source methodology; source footnote ‖73 |
| Eswatini | 3,000 (1999) | 93.4 | 75 | 1.60 | See source methodology; source footnote ‡35 |
| Ethiopia | 138,000 (2020) | 528.1 | 4 | 0.49 | See source methodology; source footnote § |
| Fiji | 4,000 (2020) | 81.2 | 87 | 1.33 | See source methodology; source footnote †68 |
| Finland | 22,000 (2020) | 8,081.6 | 1,437 | 2.57 | See source methodology; source footnote 85 |
| France | 304,000 (2020) | 68,007.6 | 1,021 | 2.03 | See source methodology; source footnote 101 |
| Gabon | 7,000 (2020) | 356.1 | 139 | 1.66 | See source methodology; source footnote §20 |
| Gambia | 4,000 (2020) | 14.7 | 5 | 0.57 | See source methodology; source footnote ‡§21 |
| Georgia | 26,000 (2020) | 657.9 | 173 | 1.75 | See source methodology; source footnote †§81 |
| Germany | 183,000 (2020) | 113,585.9 | 1,346 | 2.27 | See source methodology; source footnote ... |
| Ghana | 16,000 (2020) | 506.7 | 15 | 0.48 | See source methodology; source footnote ‖22 |
| Greece | 147,000 (2020) | 8,388.4 | 842 | 2.99 | See source methodology; source footnote ... |
| Grenada | Not available | Not available | Not available | Not available | See source methodology |
| Guatemala | 43,000 (2020) | 632.9 | 34 | 0.52 | See source methodology |
| Guinea | 13,000 (2020) | 600.5 | 40 | 2.03 | See source methodology; source footnote 23 |
| Guinea-Bissau | 4,000 (2020) | 22.4 | 10 | 0.89 | See source methodology; source footnote ‖24 |
| Guyana | 3,000 (2020) | 247.6 | 297 | 0.99 | See source methodology; source footnote 48 |
| Haiti | 1,000 (2020) | 39.1 | 3 | 0.12 | See source methodology; source footnote §40 |
| Holy See / Vatican City | Not available | Not available | Not available | Not available | See source methodology |
| Honduras | 23,000 (2020) | 580.2 | 53 | 1.46 | See source methodology; source footnote 41 |
| Hungary | 46,000 (2020) | 5,002.0 | 518 | 2.04 | See source methodology |
| Iceland | 0 (2020) | 0.0 | 0 | 0.00 | See source methodology; source footnote 86 |
| India | 3,068,000 (2020) | 92,057.0 | 63 | 2.30 | See source methodology; source footnote 59 |
| Indonesia | 676,000 (2020) | 15,025.4 | 53 | 1.04 | See source methodology; source footnote 62 |
| Iran | 650,000 (2020) | 7,396.1 | 80 | 2.09 | See source methodology; source footnote 92 |
| Iraq | 459,000 (2020) | 6,448.0 | 139 | 2.45 | estimate; source footnote §¶93 |
| Ireland | 9,000 (2020) | 1,551.1 | 272 | 0.22 | See source methodology; source footnote ... |
| Israel | 178,000 (2020) | 48,281.3 | 5,108 | 7.81 | See source methodology; source footnote 94 |
| Italy | 338,000 (2020) | 48,143.6 | 813 | 1.89 | See source methodology; source footnote 87 |
| Jamaica | 6,000 (2020) | 286.6 | 101 | 1.37 | See source methodology |
| Japan | 261,000 (2020) | 62,158.1 | 504 | 1.41 | See source methodology; source footnote 56 |
| Jordan | 116,000 (2020) | 2,555.4 | 221 | 4.56 | See source methodology; source footnote † |
| Kazakhstan | 71,000 (2020) | 1,308.6 | 63 | 0.43 | See source methodology; source footnote † |
| Kenya | 24,000 (2020) | 1,469.7 | 26 | 1.07 | See source methodology; source footnote † |
| Kiribati | Not available | Not available | Not available | Not available | See source methodology |
| Kosovo | Not available | 234.5 | 140 | 1.85 | See source methodology |
| Kuwait | 25,000 (2020) | 8,088.3 | 1,623 | 4.69 | See source methodology; source footnote 95 |
| Kyrgyzstan | 21,000 (2020) | 601.1 | 83 | 2.92 | estimate; source footnote 52 |
| Laos | 129,000 (2020) | Not available | Not available | Not available | See source methodology; source footnote § |
| Latvia | 9,000 (2020) | 1,731.6 | 929 | 3.61 | See source methodology; source footnote ‖75 |
| Lebanon | 80,000 (2020) | 828.3 | 142 | 2.51 | estimate; source footnote §106 |
| Lesotho | 2,000 (2020) | 39.9 | 17 | 1.63 | See source methodology; source footnote § |
| Liberia | 2,000 (2020) | 44.2 | 8 | 0.85 | See source methodology; source footnote 25 |
| Libya | 0 (2020) | Not available | Not available | Not available | See source methodology; source footnote द16 |
| Liechtenstein | Not available | Not available | Not available | Not available | See source methodology |
| Lithuania | 37,000 (2020) | 2,952.2 | 1,035 | 3.08 | See source methodology; source footnote ‖ |
| Luxembourg | 1,000 (2020) | 855.4 | 1,264 | 0.85 | estimate; source footnote 88 |
| Madagascar | 22,000 (2020) | 119.7 | 4 | 0.62 | See source methodology; source footnote ‖26 |
| Malawi | 15,000 (2020) | 162.8 | 7 | 1.15 | See source methodology |
| Malaysia | 136,000 (2020) | 4,933.2 | 138 | 1.04 | See source methodology; source footnote 63 |
| Maldives | 5,000 (2000) | Not available | Not available | Not available | See source methodology |
| Mali | 41,000 (2020) | 952.9 | 38 | 3.87 | See source methodology; source footnote ¶ |
| Malta | 2,000 (2020) | 124.7 | 230 | 0.45 | See source methodology; source footnote †‖ |
| Marshall Islands | Not available | Not available | Not available | Not available | See source methodology |
| Mauritania | 21,000 (2020) | 321.8 | 61 | 2.75 | See source methodology; source footnote § |
| Mauritius | 3,000 (2020) | 23.8 | 19 | 0.15 | See source methodology; source footnote † |
| Mexico | 341,000 (2020) | 13,647.7 | 104 | 0.74 | See source methodology |
| Micronesia | Not available | Not available | Not available | Not available | See source methodology |
| Moldova | 6,000 (2020) | 113.3 | 38 | 0.56 | See source methodology; source footnote †¶82 |
| Monaco | Not available | Not available | Not available | Not available | See source methodology |
| Mongolia | 18,000 (2020) | 221.3 | 63 | 0.88 | See source methodology |
| Montenegro | 12,000 (2020) | 176.5 | 277 | 1.89 | See source methodology; source footnote 76 |
| Morocco | 246,000 (2020) | 6,330.7 | 165 | 3.54 | See source methodology; source footnote §17 |
| Mozambique | 11,000 (2020) | 468.1 | 13 | 1.87 | See source methodology; source footnote ‖27 |
| Myanmar | 463,000 (2020) | Not available | Not available | Not available | See source methodology; source footnote §¶64 |
| Namibia | 16,000 (2020) | 410.5 | 134 | 2.77 | See source methodology |
| Nauru | Not available | Not available | Not available | Not available | See source methodology |
| Nepal | 112,000 (2020) | 428.3 | 14 | 0.97 | See source methodology; source footnote ¶ |
| Netherlands | 41,000 (2020) | 28,944.3 | 1,582 | 2.19 | See source methodology; source footnote ... |
| New Zealand | 10,000 (2020) | 2,855.7 | 546 | 1.10 | See source methodology |
| Nicaragua | 12,000 (2020) | 116.4 | 17 | 0.56 | See source methodology; source footnote 42 |
| Niger | 10,000 (2020) | 488.9 | 18 | 2.14 | See source methodology |
| Nigeria | 223,000 (2020) | 2,101.7 | 9 | 0.91 | See source methodology; source footnote §28 |
| Niue | Not available | Not available | Not available | Not available | See source methodology |
| North Korea | 1,469,000 (2020) | Not available | Not available | Not available | See source methodology; source footnote 57 |
| North Macedonia | 16,000 (2020) | 374.8 | 206 | 1.97 | See source methodology; source footnote †77 |
| Norway | 25,000 (2020) | 17,033.6 | 3,040 | 3.28 | See source methodology; source footnote ... |
| Oman | 47,000 (2020) | 5,988.3 | 1,109 | 5.68 | estimate; source footnote ‡96 |
| Pakistan | 943,000 (2020) | 11,871.4 | 47 | 2.91 | See source methodology; source footnote 60 |
| Palau | Not available | Not available | Not available | Not available | See source methodology |
| Palestine | 0 (2020) | Not available | Not available | Not available | See source methodology |
| Panama | 28,000 (2020) | 0.0 | 0 | 0.00 | See source methodology; source footnote 43 |
| Papua New Guinea | 4,000 (2020) | 106.5 | 10 | 0.35 | See source methodology; source footnote ¶69 |
| Paraguay | 29,000 (2020) | 421.1 | 60 | 0.88 | See source methodology; source footnote 49 |
| Peru | 158,000 (2020) | 2,596.2 | 75 | 0.81 | See source methodology; source footnote 50 |
| Philippines | 157,000 (2020) | 6,378.8 | 55 | 1.30 | See source methodology; source footnote 65 |
| Poland | 189,000 (2020) | 46,760.1 | 1,219 | 4.50 | See source methodology; source footnote 78 |
| Portugal | 52,000 (2020) | 5,861.3 | 563 | 1.71 | See source methodology; source footnote ... |
| Qatar | 22,000 (2020) | Not available | Not available | Not available | See source methodology; source footnote §102 |
| Republic of the Congo | 12,000 (2020) | 204.9 | 32 | 1.31 | See source methodology; source footnote § |
| Romania | 128,000 (2020) | 9,725.4 | 513 | 2.28 | See source methodology; source footnote ¶‖ |
| Russia | 1,454,000 (2020) | 190,416.6 | 1,318 | 7.50 | estimate; source footnote 83 |
| Rwanda | 35,000 (2020) | 191.2 | 13 | 1.29 | See source methodology; source footnote 29 |
| Saint Kitts and Nevis | Not available | Not available | Not available | Not available | See source methodology |
| Saint Lucia | Not available | Not available | Not available | Not available | See source methodology |
| Saint Vincent and the Grenadines | Not available | Not available | Not available | Not available | See source methodology |
| Samoa | Not available | Not available | Not available | Not available | See source methodology |
| San Marino | Not available | Not available | Not available | Not available | See source methodology |
| Sao Tome and Principe | 1,000 (1999) | Not available | Not available | Not available | See source methodology |
| Saudi Arabia | 282,000 (2020) | 83,181.3 | 2,428 | 6.48 | estimate; source footnote 97 |
| Senegal | 19,000 (2020) | 566.9 | 30 | 1.56 | See source methodology; source footnote §30 |
| Serbia | 32,000 (2020) | 2,781.3 | 414 | 2.76 | estimate; source footnote 79 |
| Seychelles | 0 (2020) | 28.4 | 216 | 1.24 | See source methodology; source footnote † |
| Sierra Leone | 9,000 (2020) | 32.2 | 4 | 0.37 | See source methodology; source footnote 31 |
| Singapore | 59,000 (2020) | 17,438.5 | 2,980 | 3.05 | See source methodology |
| Slovakia | 18,000 (2020) | 3,118.3 | 568 | 2.03 | See source methodology; source footnote ‖ |
| Slovenia | 7,000 (2020) | 1,221.7 | 577 | 1.54 | See source methodology; source footnote ‖ |
| Solomon Islands | Not available | Not available | Not available | Not available | See source methodology |
| Somalia | 14,000 (2020) | 199.5 | 10 | 1.54 | See source methodology; source footnote 32 |
| South Africa | 89,000 (2020) | 3,173.9 | 49 | 0.74 | See source methodology |
| South Korea | 569,000 (2020) | 47,770.9 | 924 | 2.60 | See source methodology; source footnote 58 |
| South Sudan | 53,000 (2020) | 178.4 | 15 | 3.42 | See source methodology; source footnote 33 |
| Spain | 199,000 (2020) | 40,211.8 | 839 | 2.13 | See source methodology; source footnote 89 |
| Sri Lanka | 317,000 (2020) | 1,390.7 | 60 | 1.31 | See source methodology; source footnote 61 |
| Sudan | 144,000 (2020) | Not available | Not available | Not available | See source methodology; source footnote §‖34 |
| Suriname | 2,000 (2020) | Not available | Not available | Not available | See source methodology |
| Sweden | 15,000 (2020) | 16,473.5 | 1,549 | 2.47 | See source methodology; source footnote ... |
| Switzerland | 20,000 (2020) | 7,591.4 | 849 | 0.76 | See source methodology; source footnote †¶90 |
| Syria | 269,000 (2020) | Not available | Not available | Not available | See source methodology; source footnote § |
| Taiwan | Not available | 18,187.7 | 785 | 2.10 | See source methodology; source footnote †¶104 |
| Tajikistan | 17,000 (2020) | 246.9 | 23 | 1.47 | See source methodology; source footnote § |
| Tanzania | 28,000 (2020) | 1,030.5 | 15 | 1.16 | See source methodology |
| Thailand | 455,000 (2020) | 5,984.0 | 84 | 1.04 | See source methodology; source footnote § |
| Timor-Leste | 2,000 (2020) | 47.9 | 34 | 2.25 | See source methodology; source footnote §66 |
| Togo | 10,000 (2020) | 204.9 | 21 | 1.87 | See source methodology |
| Tonga | Not available | Not available | Not available | Not available | See source methodology |
| Trinidad and Tobago | 5,000 (2020) | 229.9 | 152 | 0.94 | See source methodology |
| Tunisia | 48,000 (2020) | 1,484.9 | 121 | 2.49 | See source methodology |
| Turkmenistan | 57,000 (2020) | Not available | Not available | Not available | See source methodology; source footnote §53 |
| Tuvalu | Not available | Not available | Not available | Not available | See source methodology |
| Türkiye | 512,000 (2020) | 29,986.7 | 342 | 1.91 | See source methodology; source footnote ‖105 |
| Uganda | 46,000 (2020) | 1,297.0 | 26 | 1.96 | See source methodology |
| Ukraine | 298,000 (2020) | 84,109.0 | 2,197 | 39.56 | estimate; source footnote 84 |
| United Arab Emirates | 63,000 (2020) | Not available | Not available | Not available | See source methodology; source footnote §98 |
| United Kingdom | 153,000 (2020) | 88,977.5 | 1,283 | 2.35 | See source methodology; source footnote 91 |
| United States | 1,395,000 (2020) | 954,387.0 | 2,755 | 3.12 | See source methodology; source footnote 44 |
| Uruguay | 22,000 (2020) | 1,954.3 | 577 | 2.28 | See source methodology |
| Uzbekistan | 68,000 (2020) | Not available | Not available | Not available | See source methodology; source footnote §54 |
| Vanuatu | Not available | Not available | Not available | Not available | See source methodology |
| Venezuela | 343,000 (2020) | Not available | Not available | Not available | See source methodology; source footnote ‖51 |
| Vietnam | 522,000 (2020) | 10,487.3 | 104 | 2.15 | See source methodology; source footnote §67 |
| Yemen | 40,000 (2020) | Not available | Not available | Not available | See source methodology; source footnote §99 |
| Zambia | 16,000 (2020) | 405.9 | 19 | 1.26 | See source methodology; source footnote § |
| Zimbabwe | 51,000 (2020) | 159.6 | 10 | 0.56 | high uncertainty; source footnote §‖36 |
151 houses have a numerical 2025 expenditure observation; 174 have a historical personnel observation. Missing entries remain listed so no country house disappears from the discussion.